
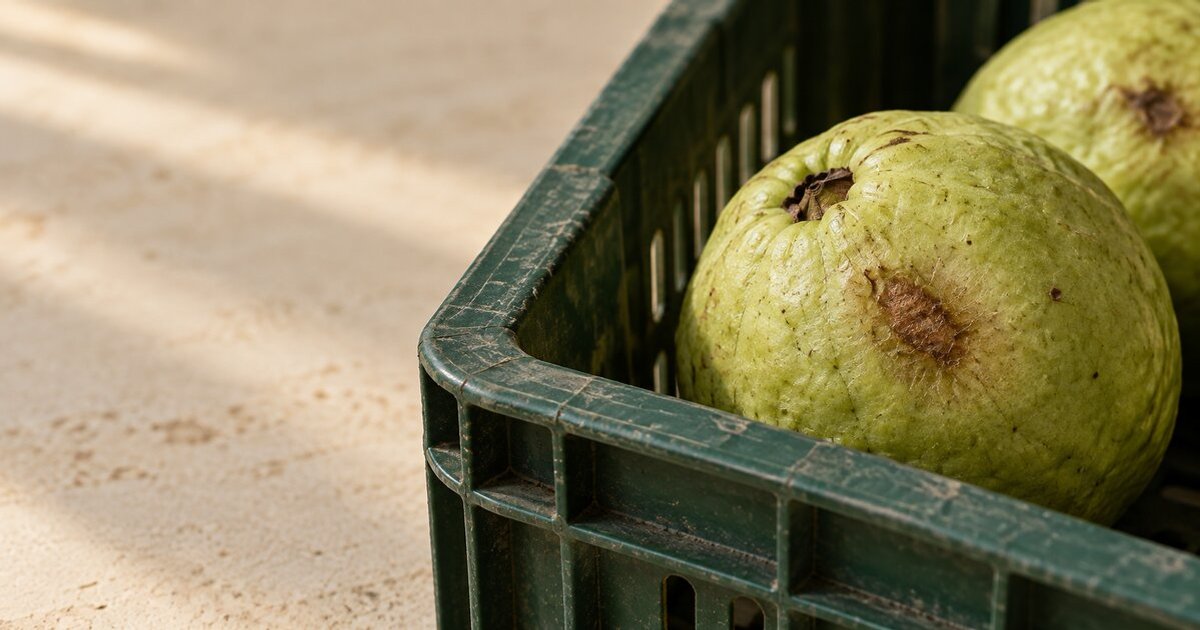
A rejected crate at a Chennai receiving bay raises a local question: what arrived, what failed the agreed specification, and where will it go next? A national fruit-loss percentage answers a different question. Confusing the two can turn a useful research finding into a poor buying assumption.
The distinction matters when a buyer compares suppliers, a processor proposes a new plant, or a reader encounters a large food-loss claim. Before using the percentage, look for the crop, the observation years and the stages being counted. Those details determine what the number can explain.
The range is not an average
A March 2026 government reply reports the fruit-loss range of 6.02–15.05% from the NABCONS 2022 study. It dates the study’s reference years to 2020–22. The reply’s publication date does not turn those estimates into measurements of the 2026 harvest.
The original report lets us move beyond the range. These are selected national crop estimates from Table 6.4, on printed page 86 of the NABCONS study.
| Fruit | Farm-operations loss | Market-stage loss | Overall loss |
|---|---|---|---|
| Pineapple | 4.22% | 1.80% | 6.02% |
| Banana | 5.17% | 2.40% | 7.57% |
| Mango | 6.03% | 2.50% | 8.53% |
| Guava | 11.59% | 3.46% | 15.05% |
These are the report’s point estimates. Its full table also gives uncertainty estimates; the decimal places should not be read as certainty about an individual consignment. The selected rows illustrate variation, rather than representing a buyer’s basket or every fruit grown in India.
The table’s mango total, for example, is 6.03 + 2.50 = 8.53%. The farm and market figures are already components of the reported total. Adding that total to either component would count the same loss twice.
Averaging the pineapple and guava endpoints would not produce India’s fruit loss rate. A combined estimate needs an explicit weighting method and the quantities to which the crop rates apply. A truck carrying one fruit, a mixed wholesale business and the country’s whole harvest are different populations.
Follow the boundary through the chain
The government describes the study as covering 54 crops and commodities. Its stages include harvesting, sorting and grading, storage and transport, along with wholesalers, retailers and processing units (MoFPI’s stage-level explanation). So the market column is broader than damaged fruit found on a wholesale truck.
International terminology needs the same care. FAO’s Food Loss Index covers harvest up to, but excluding, retail. Its measurement guidance places retail and consumption waste under the separate Food Waste Index. The Indian table above includes a retailer column, so it should not be casually relabelled as an FAO Food Loss Index estimate (FAO measurement guidance).
This is a practical distinction. A processor may be concerned with fruit rejected before pulping. A hotel may be concerned with breakfast fruit left on plates. Both want less discarded food, but they need different records, denominators and interventions.
A hotel measuring its later discards can use a food-waste log organised by waste point. Keeping storage, preparation, unserved surplus and plate waste separate makes those records useful without pretending they measure the earlier farm and market chain.
National loss is not a supplier rejection allowance
A buyer cannot use the guava estimate to decide that a similar share of a particular delivery is acceptable to reject. The national estimate describes loss across the studied chain. A receiving specification describes the condition, grade and quantity promised at one handover.
Nor does rejection alone prove that the fruit has left the food supply. A returned lot may have another permitted destination. Its eventual handling must be traced before calling the entire returned weight food lost. A credit note records a commercial adjustment; it does not record the fruit’s fate.
Consider an explicitly hypothetical receipt of 100 kg. The buyer accepts 96 kg and returns 4 kg against the purchase specification. That gives a 4% receiving rejection rate, calculated as 4 ÷ 100 × 100. If the supplier’s record shows that the returned fruit was sold for an appropriate food use, calling all 4 kg discarded would misdescribe the event.
Suppose the buyer later discards 3 kg from the accepted lot before use. On the accepted-weight denominator, that is 3 ÷ 96 × 100 = 3.125%. Adding 4% and 3.125% would mix different denominators and different events. Keep the kilograms, dates and destinations available so a reviewer can reconstruct the account.
These figures are an arithmetic example, not an observed loss rate or recommended target.
For an actual temperature-controlled purchase, a documented chilled-food receiving check helps organise the handover evidence. Its chilled and frozen limits should not be copied into specifications for every fresh fruit; this article does not prescribe a universal fruit-storage temperature.
Once ingredients enter kitchen use, the next accounting question is how purchases and stock changes become consumption. Our food-cost percentage explainer covers that calculation. It needs the outlet’s own records, rather than a national post-harvest allowance added to every invoice.
A national loss estimate can identify a question. It cannot certify the condition of the next crate.
What a cold-chain proposal still has to prove
The NABCONS table gives a reason to look upstream as well as at market storage. For each fruit shown, the reported farm-operations component exceeds the market component. But even that comparison does not identify which single investment will work on a particular route.
A proposed city cold store has to explain which observed losses it can affect. It cannot recover fruit already lost before arrival. A sorting line has to explain what happens to the separated grades. A processor needs a usable incoming specification and a destination for its output; a national loss total is not a supply contract.
The reasonable next step is a bounded comparison using actual lots. That can begin with a shared receiving sheet and a supplier conversation; it does not require a large software project. Small buyers may lack access to farm records, so the first measured boundary can simply be dispatch to receipt. Name that limit instead of filling the gap with a national number.
Make a proposal reviewable
Record the fruit, grade, route, dates and where measurement begins and ends. Keep gross crate weight separate from net produce weight.
Separate accepted, returned, diverted and discarded produce. Record who holds the next part of the account when the lot changes hands.
Compare similar lots with the proposed handling change. Record differences in fruit condition and timing that could explain the result.
Calculate the value retained using actual realised prices, then include the added handling, storage and transport costs. Keep unmeasured benefits outside the savings claim.